# 一.介绍
Pyecharts 是一个用于数据分析的 Python 可视化库,它基于 ECharts,提供了一套简单易用的 Python 接口用于创建交互式的图表。Pyecharts 的主要功能和作用如下:
支持多种图表类型:Pyecharts 支持多种常用的图表类型,包括折线图、柱状图、散点图、热力图等等,可以满足不同的数据可视化需求。
简单易用的 API:Pyecharts 的 API 设计简单易用,可以快速地创建和配置图表,支持链式调用和函数式调用两种方式。
支持多种数据格式:Pyecharts 支持多种数据格式,包括 CSV、JSON、pandas 数据框等等,可以方便地处理来自不同数据源的数据。
可定制化的主题和样式:Pyecharts 支持多种主题和样式,可以根据自己的需求进行定制,使图表更加美观和易于阅读。
支持交互式操作:Pyecharts 支持交互式操作,可以通过鼠标滚轮、拖拽等方式对图表进行缩放、平移等操作,方便用户进行数据探索和分析。
Pyecharts 是一个功能强大、易于使用、高度可定制的 Python 数据可视化库,可以帮助用户快速地创建交互式的图表,展示和分析数据。
# 二.案例
# 1.GDP 案例
# 导包
from pyecharts.charts import Line
from pyecharts.options import TitleOpts, LegendOpts, ToolboxOpts, VisualMapOpts

# 创建一个折线图对象
line = Line()
# 给折线图对象添加x轴的数据
line.add_xaxis(["中国", "美国", "英国"])
# 给折线图对象添加y轴的数据
line.add_yaxis("GDP", [30, 20, 10])

# 设置全局配置项set_global_opts来设置,
line.set_global_opts(
    title_opts=TitleOpts(title="GDP展示", pos_left="center", pos_bottom="1%"),
    legend_opts=LegendOpts(is_show=True),
    toolbox_opts=ToolboxOpts(is_show=True),
    visualmap_opts=VisualMapOpts(is_show=True),
)

# 通过render方法,将代码生成为图像
line.render()
1
2
3
4
5
6
7
8
9
10
11
12
13
14
15
16
17
18
19
20
21
2
3
4
5
6
7
8
9
10
11
12
13
14
15
16
17
18
19
20
21
生长一个 render.html

# 2.折线图案例
import json
from pyecharts.charts import Line
from pyecharts.options import TitleOpts, LabelOpts

# 处理数据
f_us = open("/Users/qinyingjie/Documents/idea-workspace/study/python-demo/data/折线图数据/美国.txt", "r", encoding="UTF-8")
us_data = f_us.read()  # 美国的全部内容

f_jp = open("/Users/qinyingjie/Documents/idea-workspace/study/python-demo/data/折线图数据/日本.txt", "r", encoding="UTF-8")
jp_data = f_jp.read()  # 日本的全部内容

f_in = open("/Users/qinyingjie/Documents/idea-workspace/study/python-demo/data/折线图数据/印度.txt", "r", encoding="UTF-8")
in_data = f_in.read()  # 印度的全部内容

# 去掉不合JSON规范的开头
us_data = us_data.replace("jsonp_1629344292311_69436(", "")
jp_data = jp_data.replace("jsonp_1629350871167_29498(", "")
in_data = in_data.replace("jsonp_1629350745930_63180(", "")

# 去掉不合JSON规范的结尾
us_data = us_data[:-2]
jp_data = jp_data[:-2]
in_data = in_data[:-2]

# JSON转Python字典
us_dict = json.loads(us_data)
jp_dict = json.loads(jp_data)
in_dict = json.loads(in_data)

# 获取trend key
us_trend_data = us_dict['data'][0]['trend']
jp_trend_data = jp_dict['data'][0]['trend']
in_trend_data = in_dict['data'][0]['trend']

# 获取日期数据,用于x轴,取2020年(到314下标结束)
us_x_data = us_trend_data['updateDate'][:314]
jp_x_data = jp_trend_data['updateDate'][:314]
in_x_data = in_trend_data['updateDate'][:314]

# 获取确认数据,用于y轴,取2020年(到314下标结束)
us_y_data = us_trend_data['list'][0]['data'][:314]
jp_y_data = jp_trend_data['list'][0]['data'][:314]
in_y_data = in_trend_data['list'][0]['data'][:314]

# 生成图表
line = Line()  # 构建折线图对象
# 添加x轴数据
line.add_xaxis(us_x_data)  # x轴是公用的,所以使用一个国家的数据即可
# 添加y轴数据
line.add_yaxis("美国确诊人数", us_y_data, label_opts=LabelOpts(is_show=False))  # 添加美国的y轴数据
line.add_yaxis("日本确诊人数", jp_y_data, label_opts=LabelOpts(is_show=False))  # 添加日本的y轴数据
line.add_yaxis("印度确诊人数", in_y_data, label_opts=LabelOpts(is_show=False))  # 添加印度的y轴数据

# 设置全局选项
line.set_global_opts(
    # 标题设置
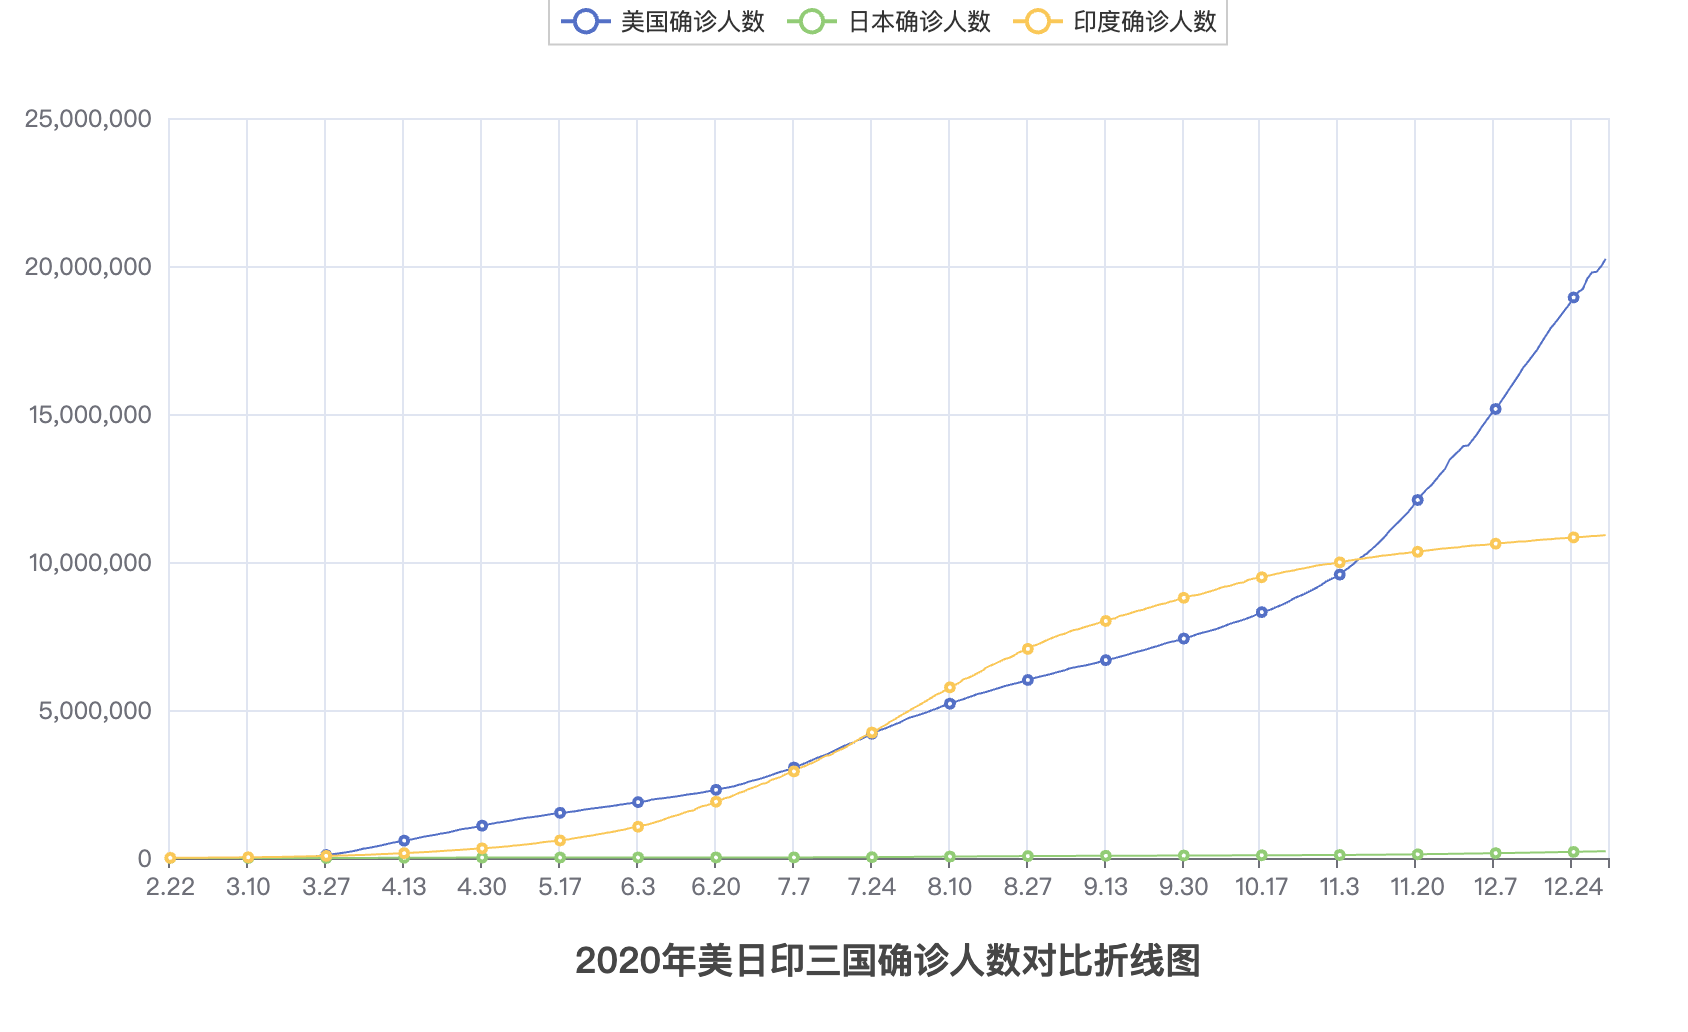
    title_opts=TitleOpts(title="2020年美日印三国确诊人数对比折线图", pos_left="center", pos_bottom="1%")
)

# 调用render方法,生成图表
line.render("折线图开发.html")
# 关闭文件对象
f_us.close()
f_jp.close()
f_in.close()
1
2
3
4
5
6
7
8
9
10
11
12
13
14
15
16
17
18
19
20
21
22
23
24
25
26
27
28
29
30
31
32
33
34
35
36
37
38
39
40
41
42
43
44
45
46
47
48
49
50
51
52
53
54
55
56
57
58
59
60
61
62
63
64
65
2
3
4
5
6
7
8
9
10
11
12
13
14
15
16
17
18
19
20
21
22
23
24
25
26
27
28
29
30
31
32
33
34
35
36
37
38
39
40
41
42
43
44
45
46
47
48
49
50
51
52
53
54
55
56
57
58
59
60
61
62
63
64
65
# 3.全国地图
from pyecharts.charts import Map
from pyecharts.options import VisualMapOpts

# 准备地图对象
map = Map()
# 准备数据
data = [
    ("北京", 1),
    ("上海", 11),
    ("湖南", 88),
    ("台湾", 399),
    ("广东", 200)
]
# 添加数据
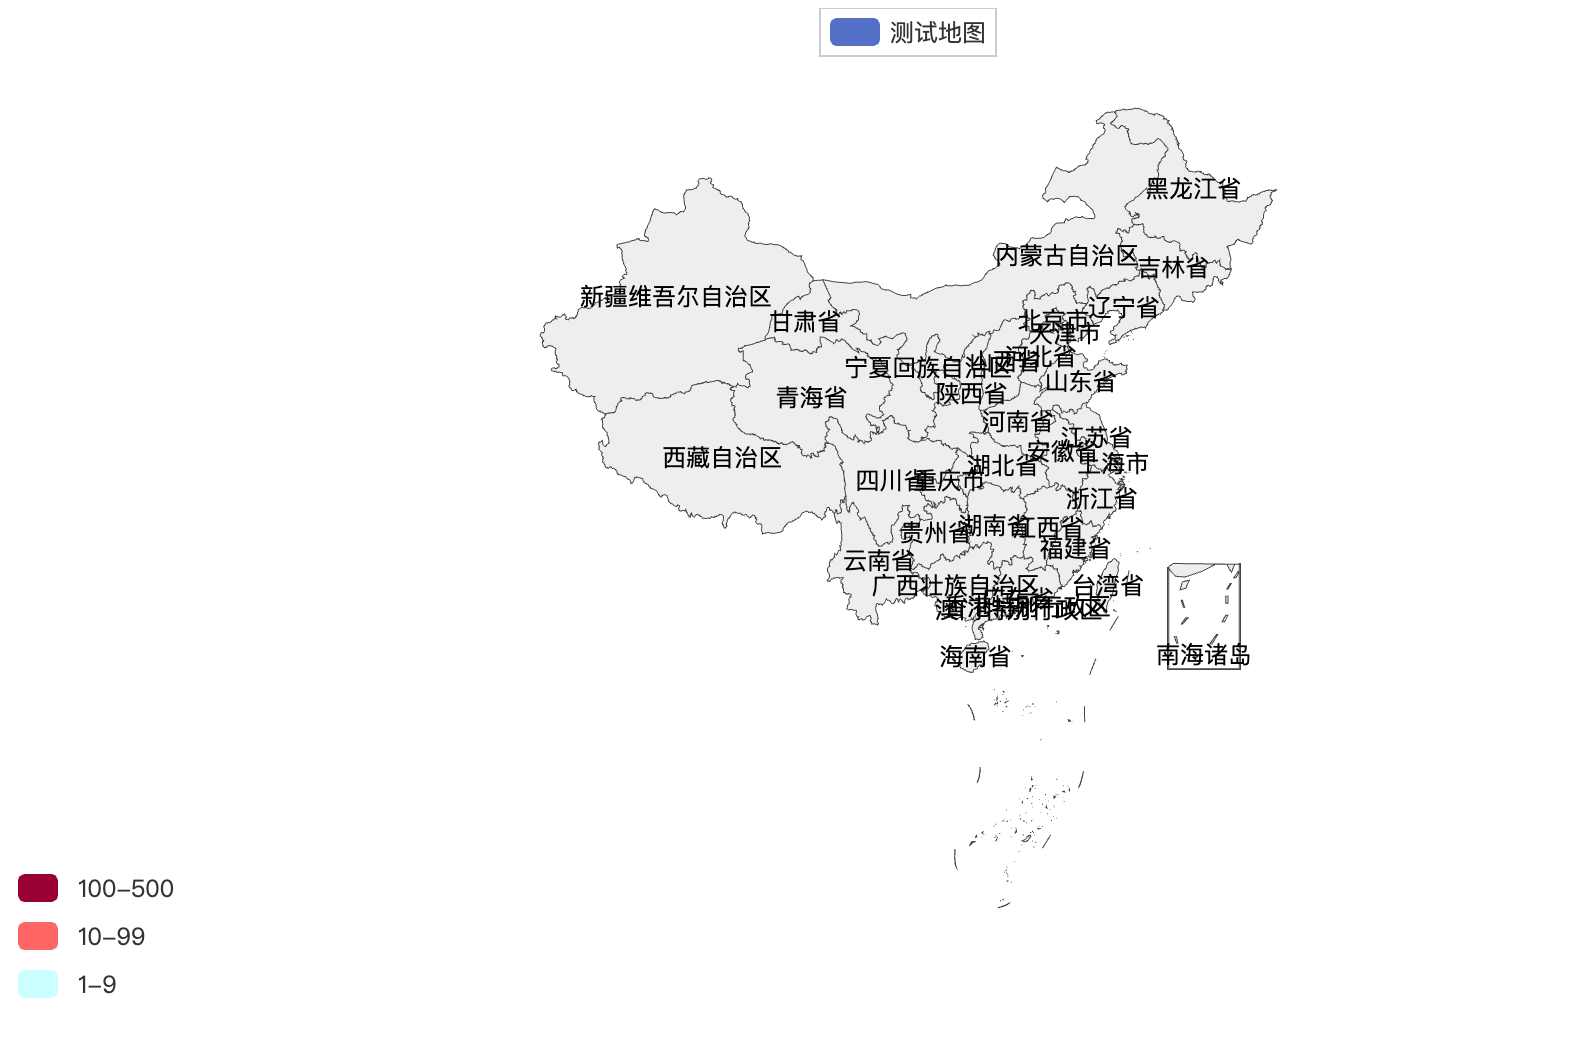
map.add("测试地图", data, "china")

# 设置全局选项
map.set_global_opts(
    visualmap_opts=VisualMapOpts(
        is_show=True,
        is_piecewise=True,
        pieces=[
            {"min": 1, "max": 9, "label": "1-9", "color": "#CCFFFF"},
            {"min": 10, "max": 99, "label": "10-99", "color": "#FF6666"},
            {"min": 100, "max": 500, "label": "100-500", "color": "#990033"}
        ]
    )
)

# 绘图
map.render("地图可视化.html")
1
2
3
4
5
6
7
8
9
10
11
12
13
14
15
16
17
18
19
20
21
22
23
24
25
26
27
28
29
30
31
2
3
4
5
6
7
8
9
10
11
12
13
14
15
16
17
18
19
20
21
22
23
24
25
26
27
28
29
30
31
# 4.全国疫情地图
import json
from pyecharts.charts import Map
from pyecharts.options import *

# 读取数据文件
f = open("/Users/qinyingjie/Documents/idea-workspace/study/python-demo/data/地图数据/疫情.txt", "r", encoding="UTF-8")
data = f.read()  # 全部数据
# 关闭文件
f.close()
# 取到各省数据
# 将字符串json转换为python的字典
data_dict = json.loads(data)  # 基础数据字典
# 从字典中取出省份的数据
province_data_list = data_dict["areaTree"][0]["children"]
# 组装每个省份和确诊人数为元组,并各个省的数据都封装入列表内
data_list = []  # 绘图需要用的数据列表
for province_data in province_data_list:
    province_name = province_data["name"]  # 省份名称
    province_confirm = province_data["total"]["confirm"]  # 确诊人数
    data_list.append((province_name, province_confirm))

# 创建地图对象
map = Map()
# 添加数据
map.add("各省份确诊人数", data_list, "china")
# 设置全局配置,定制分段的视觉映射
map.set_global_opts(
    title_opts=TitleOpts(title="全国疫情地图"),
    visualmap_opts=VisualMapOpts(
        is_show=True,  # 是否显示
        is_piecewise=True,  # 是否分段
        pieces=[
            {"min": 1, "max": 99, "lable": "1~99人", "color": "#CCFFFF"},
            {"min": 100, "max": 999, "lable": "100~9999人", "color": "#FFFF99"},
            {"min": 1000, "max": 4999, "lable": "1000~4999人", "color": "#FF9966"},
            {"min": 5000, "max": 9999, "lable": "5000~99999人", "color": "#FF6666"},
            {"min": 10000, "max": 99999, "lable": "10000~99999人", "color": "#CC3333"},
            {"min": 100000, "lable": "100000+", "color": "#990033"},
        ]
    )
)
# 绘图
map.render("全国疫情地图.html")
1
2
3
4
5
6
7
8
9
10
11
12
13
14
15
16
17
18
19
20
21
22
23
24
25
26
27
28
29
30
31
32
33
34
35
36
37
38
39
40
41
42
43
2
3
4
5
6
7
8
9
10
11
12
13
14
15
16
17
18
19
20
21
22
23
24
25
26
27
28
29
30
31
32
33
34
35
36
37
38
39
40
41
42
43

# 5.省级疫情地图
import json
from pyecharts.charts import Map
from pyecharts.options import *

# 读取文件
f = open("/Users/qinyingjie/Documents/idea-workspace/study/python-demo/data/地图数据/疫情.txt", "r", encoding="UTF-8")
data = f.read()
# 关闭文件
f.close()
# 获取河南省数据
# json数据转换为python字典
data_dict = json.loads(data)
# 取到河南省数据
cities_data = data_dict["areaTree"][0]["children"][3]["children"]

# 准备数据为元组并放入list
data_list = []
for city_data in cities_data:
    city_name = city_data["name"] + "市"
    city_confirm = city_data["total"]["confirm"]
    data_list.append((city_name, city_confirm))

# 手动添加济源市的数据
data_list.append(("济源市", 5))

# 构建地图
map = Map()
map.add("河南省疫情分布", data_list, "河南")
# 设置全局选项
map.set_global_opts(
    title_opts=TitleOpts(title="河南省疫情地图"),
    visualmap_opts=VisualMapOpts(
        is_show=True,  # 是否显示
        is_piecewise=True,  # 是否分段
        pieces=[
            {"min": 1, "max": 99, "lable": "1~99人", "color": "#CCFFFF"},
            {"min": 100, "max": 999, "lable": "100~9999人", "color": "#FFFF99"},
            {"min": 1000, "max": 4999, "lable": "1000~4999人", "color": "#FF9966"},
            {"min": 5000, "max": 9999, "lable": "5000~99999人", "color": "#FF6666"},
            {"min": 10000, "max": 99999, "lable": "10000~99999人", "color": "#CC3333"},
            {"min": 100000, "lable": "100000+", "color": "#990033"},
        ]
    )
)

# 绘图
map.render("河南省疫情地图.html")
1
2
3
4
5
6
7
8
9
10
11
12
13
14
15
16
17
18
19
20
21
22
23
24
25
26
27
28
29
30
31
32
33
34
35
36
37
38
39
40
41
42
43
44
45
46
47
2
3
4
5
6
7
8
9
10
11
12
13
14
15
16
17
18
19
20
21
22
23
24
25
26
27
28
29
30
31
32
33
34
35
36
37
38
39
40
41
42
43
44
45
46
47

# 6.基础柱状图
from pyecharts.charts import Bar
from pyecharts.options import LabelOpts

# 使用Bar构建基础柱状图
bar = Bar()
# 添加x轴的数据
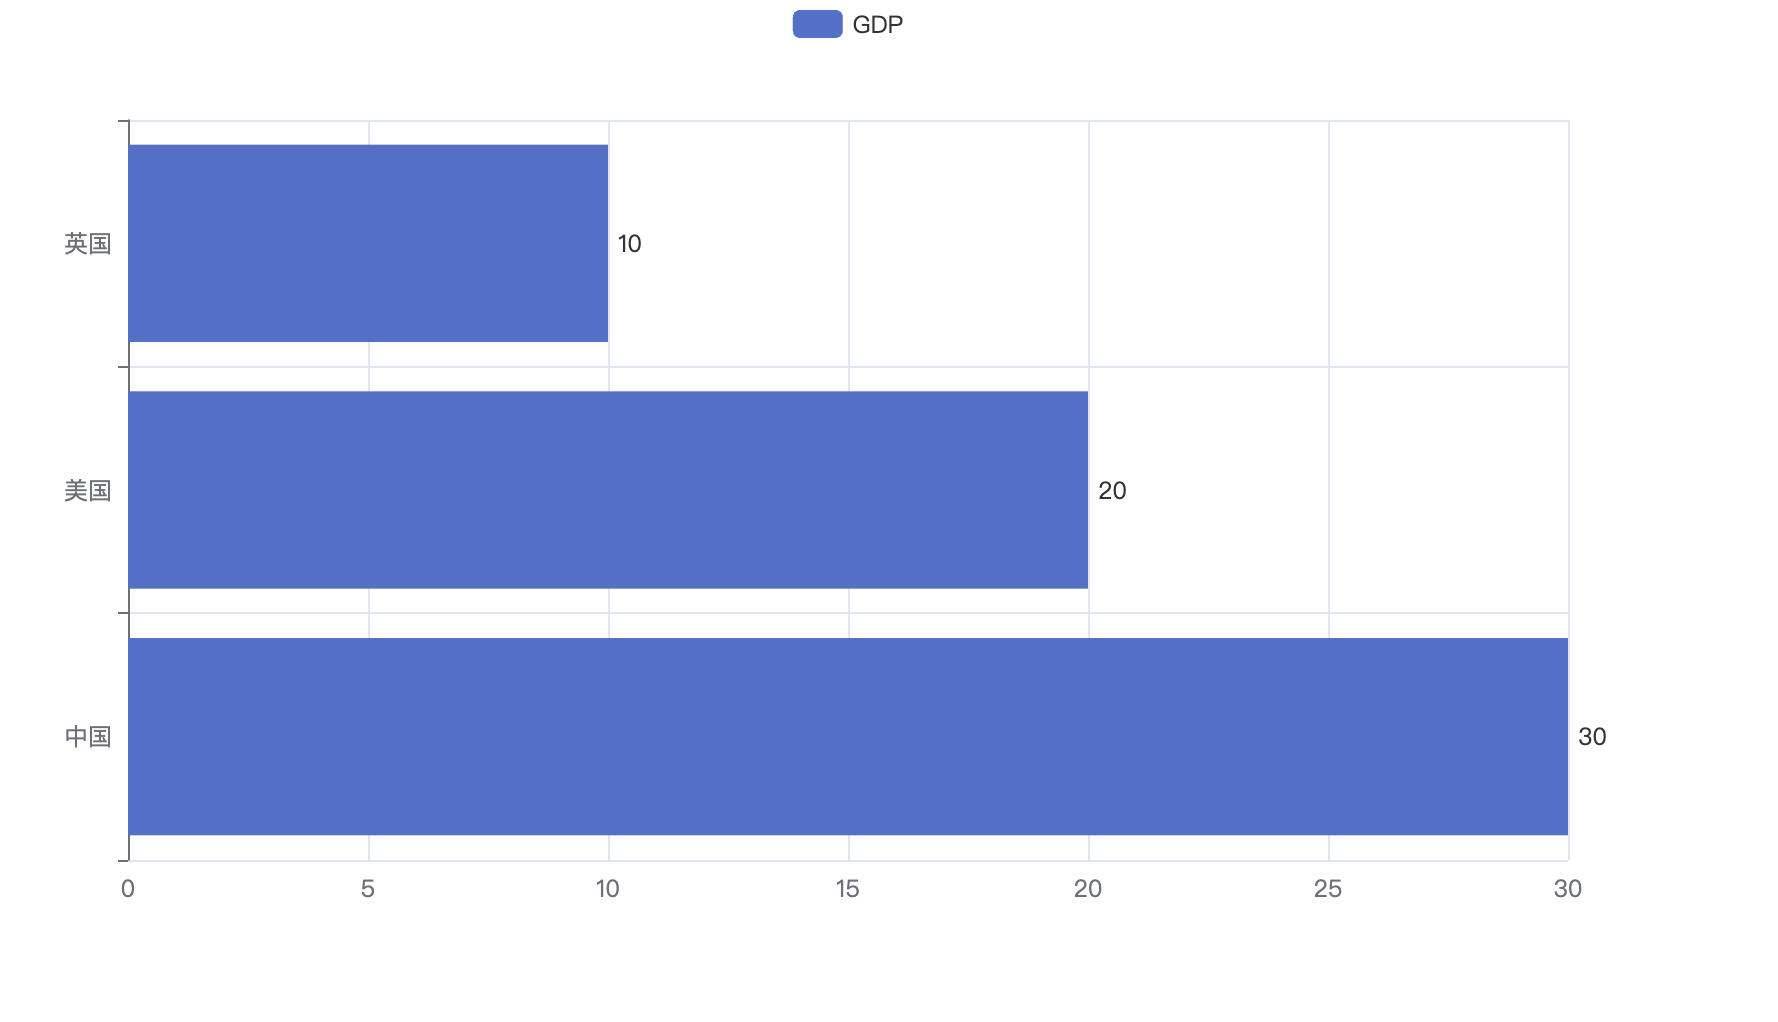
bar.add_xaxis(["中国", "美国", "英国"])
# 添加y轴数据  设置数值标签在右侧
bar.add_yaxis("GDP", [30, 20, 10], label_opts=LabelOpts(position="right"))
# 反转x和y轴
bar.reversal_axis()
# 绘图
bar.render("基础柱状图.html")
1
2
3
4
5
6
7
8
9
10
11
12
13
14
2
3
4
5
6
7
8
9
10
11
12
13
14
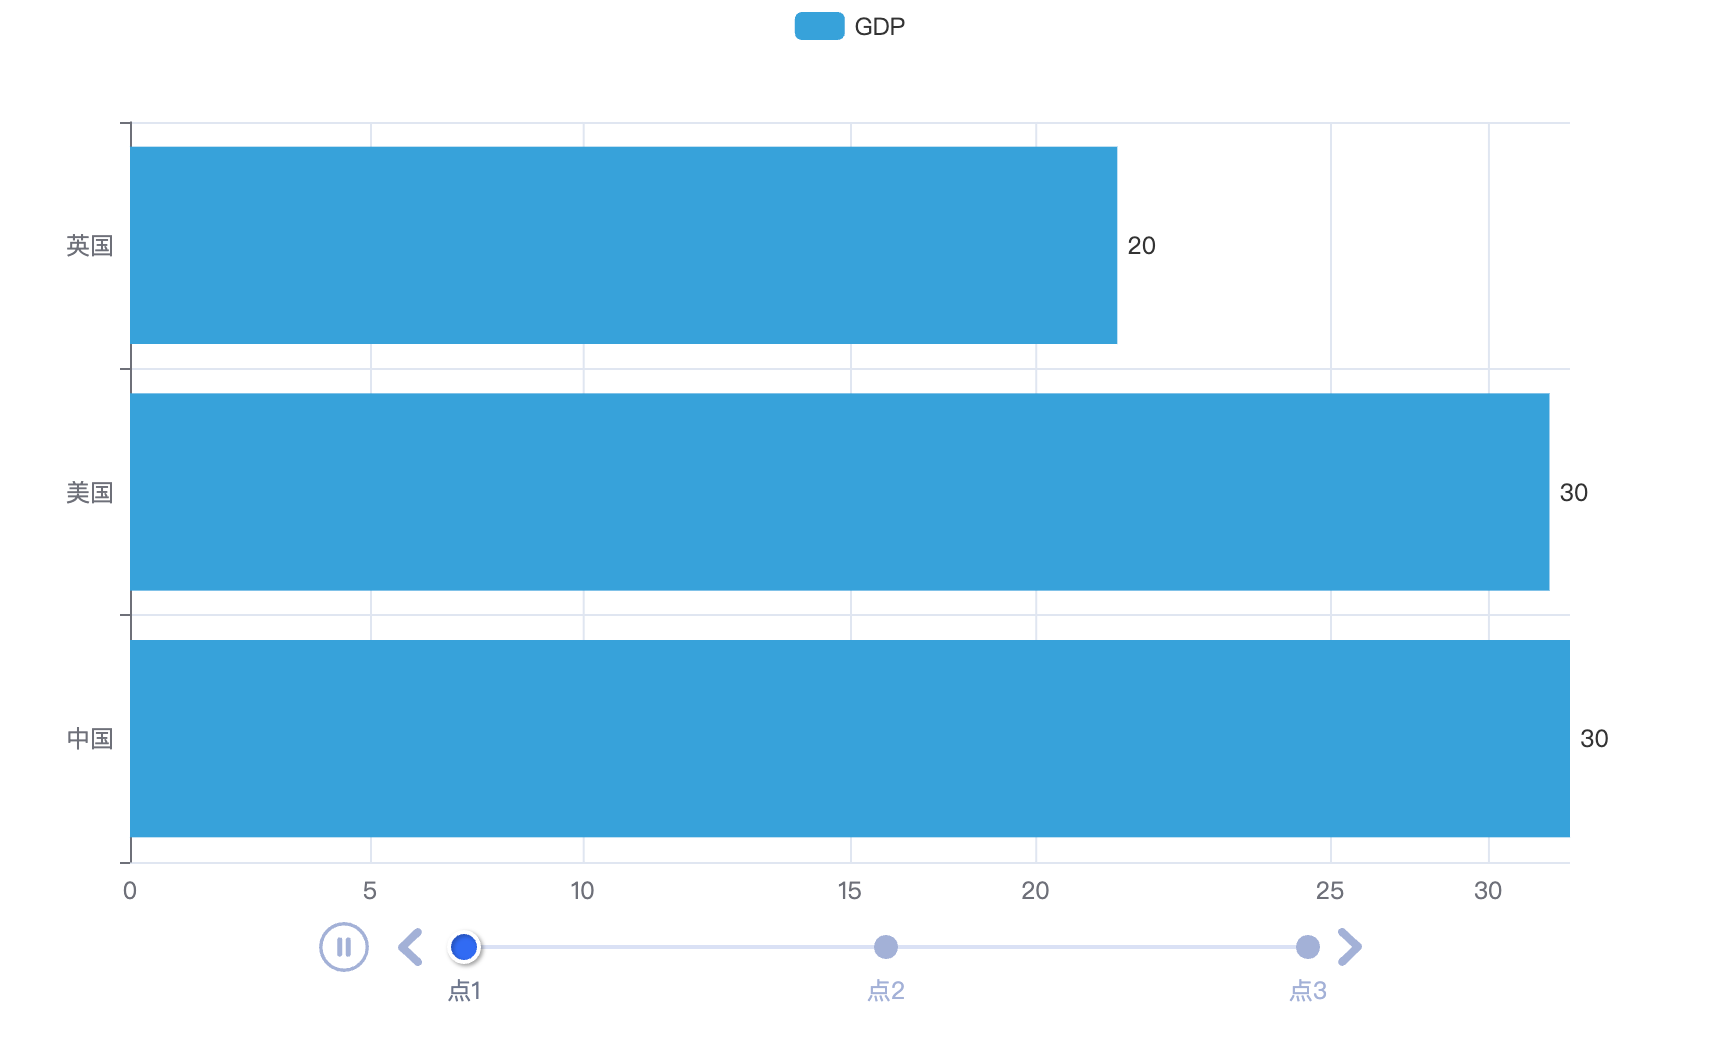
# 7.基础时间线柱状图
from pyecharts.charts import Bar, Timeline
from pyecharts.options import LabelOpts
from pyecharts.globals import ThemeType

bar1 = Bar()
bar1.add_xaxis(["中国", "美国", "英国"])
bar1.add_yaxis("GDP", [30, 30, 20], label_opts=LabelOpts(position="right"))
bar1.reversal_axis()

bar2 = Bar()
bar2.add_xaxis(["中国", "美国", "英国"])
bar2.add_yaxis("GDP", [50, 50, 50], label_opts=LabelOpts(position="right"))
bar2.reversal_axis()

bar3 = Bar()
bar3.add_xaxis(["中国", "美国", "英国"])
bar3.add_yaxis("GDP", [70, 60, 60], label_opts=LabelOpts(position="right"))
bar3.reversal_axis()

# 构建时间线对象
timeline = Timeline({"theme": ThemeType.LIGHT})
# 在时间线内添加柱状图对象
timeline.add(bar1, "点1")
timeline.add(bar2, "点2")
timeline.add(bar3, "点3")

# 自动播放设置
timeline.add_schema(
    play_interval=1000,
    is_timeline_show=True,
    is_auto_play=True,
    is_loop_play=True
)

# 绘图是用时间线对象绘图,而不是bar对象了
timeline.render("基础时间线柱状图.html")
1
2
3
4
5
6
7
8
9
10
11
12
13
14
15
16
17
18
19
20
21
22
23
24
25
26
27
28
29
30
31
32
33
34
35
36
2
3
4
5
6
7
8
9
10
11
12
13
14
15
16
17
18
19
20
21
22
23
24
25
26
27
28
29
30
31
32
33
34
35
36
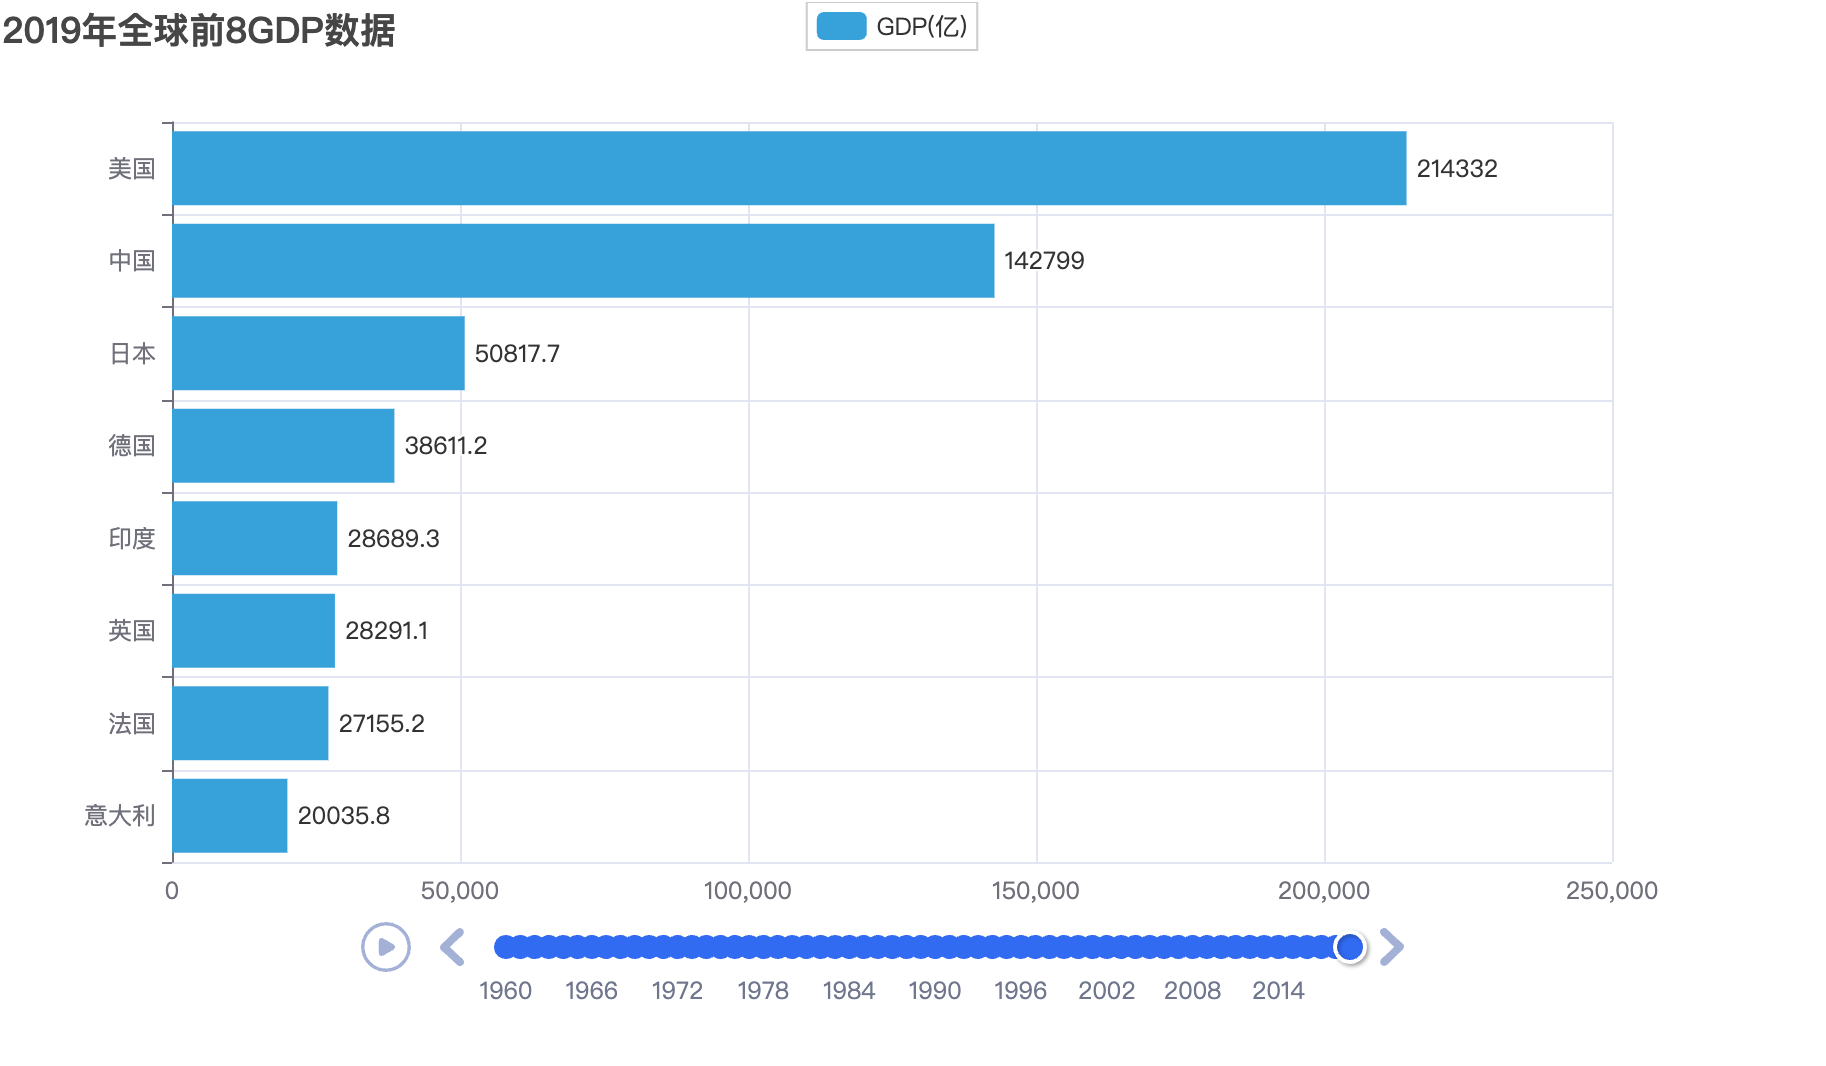
# 8.TOP8 时间轴
from pyecharts.charts import Bar, Timeline
from pyecharts.options import *
from pyecharts.globals import ThemeType

# 读取数据
f = open("/Users/qinyingjie/Documents/idea-workspace/study/python-demo/data/动态柱状图数据/1960-2019全球GDP数据.csv", "r",
         encoding="GB2312")
data_lines = f.readlines()
# 关闭文件
f.close()
# 删除第一条数据
data_lines.pop(0)
# 将数据转换为字典存储,格式为:
# { 年份: [ [国家, gdp], [国家,gdp], ......  ], 年份: [ [国家, gdp], [国家,gdp], ......  ], ...... }
# { 1960: [ [美国, 123], [中国,321], ......  ], 1961: [ [美国, 123], [中国,321], ......  ], ...... }
# 先定义一个字典对象
data_dict = {}
for line in data_lines:
    year = int(line.split(",")[0])  # 年份
    country = line.split(",")[1]  # 国家
    gdp = float(line.split(",")[2])  # gdp数据
    # 如何判断字典里面有没有指定的key呢?
    try:
        data_dict[year].append([country, gdp])
    except KeyError:
        data_dict[year] = []
        data_dict[year].append([country, gdp])

# print(data_dict[1960])
# 创建时间线对象
timeline = Timeline({"theme": ThemeType.LIGHT})
# 排序年份
sorted_year_list = sorted(data_dict.keys())
for year in sorted_year_list:
    data_dict[year].sort(key=lambda element: element[1], reverse=True)
    # 取出本年份前8名的国家
    year_data = data_dict[year][0:8]
    x_data = []
    y_data = []
    for country_gdp in year_data:
        x_data.append(country_gdp[0])  # x轴添加国家
        y_data.append(country_gdp[1] / 100000000)  # y轴添加gdp数据

    # 构建柱状图
    bar = Bar()
    x_data.reverse()
    y_data.reverse()
    bar.add_xaxis(x_data)
    bar.add_yaxis("GDP(亿)", y_data, label_opts=LabelOpts(position="right"))
    # 反转x轴和y轴
    bar.reversal_axis()
    # 设置每一年的图表的标题
    bar.set_global_opts(
        title_opts=TitleOpts(title=f"{year}年全球前8GDP数据")
    )
    timeline.add(bar, str(year))

# for循环每一年的数据,基于每一年的数据,创建每一年的bar对象
# 在for中,将每一年的bar对象添加到时间线中

# 设置时间线自动播放
timeline.add_schema(
    play_interval=1000,
    is_timeline_show=True,
    is_auto_play=True,
    is_loop_play=False
)
# 绘图
timeline.render("1960-2019全球GDP前8国家.html")
1
2
3
4
5
6
7
8
9
10
11
12
13
14
15
16
17
18
19
20
21
22
23
24
25
26
27
28
29
30
31
32
33
34
35
36
37
38
39
40
41
42
43
44
45
46
47
48
49
50
51
52
53
54
55
56
57
58
59
60
61
62
63
64
65
66
67
68
69
2
3
4
5
6
7
8
9
10
11
12
13
14
15
16
17
18
19
20
21
22
23
24
25
26
27
28
29
30
31
32
33
34
35
36
37
38
39
40
41
42
43
44
45
46
47
48
49
50
51
52
53
54
55
56
57
58
59
60
61
62
63
64
65
66
67
68
69
